
COVID-19 case rates in Arkansas are still increasing rapidly, with an emphasis in Sevier County, according to the latest predictive models by The University of Arkansas for Medical Services.
Every two weeks, the UAMS Fay W. Bozeman College of Public Health shares data from its COVID-19 models that provide short-term forecasts and long-term projections with Gov. Asa Hutchinson, the state's Department of Health and others.
The latest report confirmed the trend of Sevier County having some of the highest rates of per-capita COVID-19 cases in the state, with Montgomery on the opposite end of the spectrum, yielding the lowest rate in Arkansas.
From the set of data available from the Arkansas Department of Health from July 13 through July 15, UAMS found that Sevier held the highest rate of community cases per population of 10,000, at 473.1, while Montgomery's rate was a mere 5.3.
Last month, Sevier County had concerns about residents' reluctance to wear masks, according to County Health Officer Dr. Jason Lofton, as reported in the Gazette's June 2 story. This, combined with the high population of employees at large industries like Sevier County's Tyson Foods and Pilgrim's Pride processing plants, was speculated by Lofton to have contributed to yielding a higher rate of cases.
He also added they are doing a good job with employee safety protocols.
Miller County's community rate of cases per 10,000 population was 61.0, while Lafayette was at 39.2, Hempstead's was 37.2, and Little River fell in at 33.4.
It is important to add that cases used to calculate these rates excluded those originating in nursing homes and prisons.
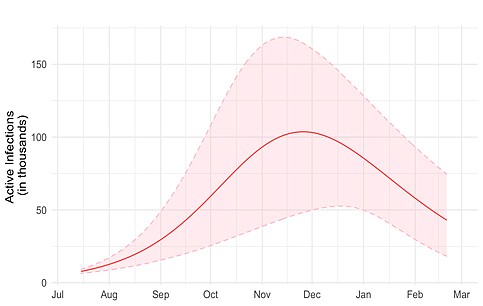
The projections show there is a peak in sight for when cases may start to plateau in Arkansas.
According to projections based on the extended state-space SIR (eSIR) model, for active infections from July 2020 to March 2021, the numbers are expected to top out in November 2020 at more than 100,000 active cases.
Mark Williams, dean of UAMS Faye Boozman College of Public Health, went into more detail on what to take from the information provided.
"As you can see in the graphic, the eSIR model is projecting, if all things remain the same, over 100,000 active cases about Nov. 24," Williams said. "The pink zone is the 95% confidence zone. What this means is we are 95% confident the true number of active cases on a given date will lie within the zone. At its peak in late November, the number of active cases could be as high as 170,000 and as low as 50,000. If you have been following the projections for a little while, the current eSIR model is projecting a more conservative number of infections, including symptomatic and asymptomatic, at the peak of the pandemic in Arkansas. The other important piece of information the eSIR model provides is the 95% confidence interval, represented by the pink zone around the red line, within which the true number on a given date will lie. So at its peak, Arkansas could have as few as 50,000 infections or as many as 158,000."
The report states that overall growth rates of recorded cases are still on the upswing.
A forecast of cases shows that while it took nearly two months for the pandemic to reach 5,000 cases in Arkansas after the first case was diagnosed on March 11, if the forecast growth rate continues, it will take three days for cases to again increase by 5,000.
The same goes for deaths from COVID-19.
Based on the 100-day model forecasts, 325 deaths were expected by Aug. 1. Using all data, however, the forecasted number of deaths by Aug. 1 will be 437. This suggests that, while not as dire as forecasts early in the epidemic, current trends indicate deaths are on an upward trend.
Williams said models will be adjusted to report any additional information they are provided with in the future.
"The parameters assigned to the infection rate and the infectious period are based on empirical observations of how other similar pathogens have (behaved), and increasing data on novel pathogens," Williams said. "What has been of interest with respect to COVID-19 was the basic coefficients for the parameters were not known in the beginning. In the beginning, models tended to use other coronaviruses and flu virus epidemics to stand in for COVID parameters. As the pandemic has gone on, models have tended to use data from the COVID-19 pandemic equations. However, as more is known about the virus, models will be adjusted to reflect new knowledge."